

The data shows that Bitcoin's price is still trading far above the depths of past bear markets, and that distance is now making the current moment feel pretty disorienting. Under the surface, a huge share of the market is already back in pain, with roughly 46% of Bitcoin's supply being held at a loss by early April.
Markets tend to get emotionally unstable when large numbers of people are trapped in losing positions, and the gap between what a price chart shows and what the holder base actually feels can be quite large. The $60,000 level stands out as a crucial threshold, affecting behavior and potentially turning a slow grind lower into a vertical drop.
The Importance of On-Chain Metrics
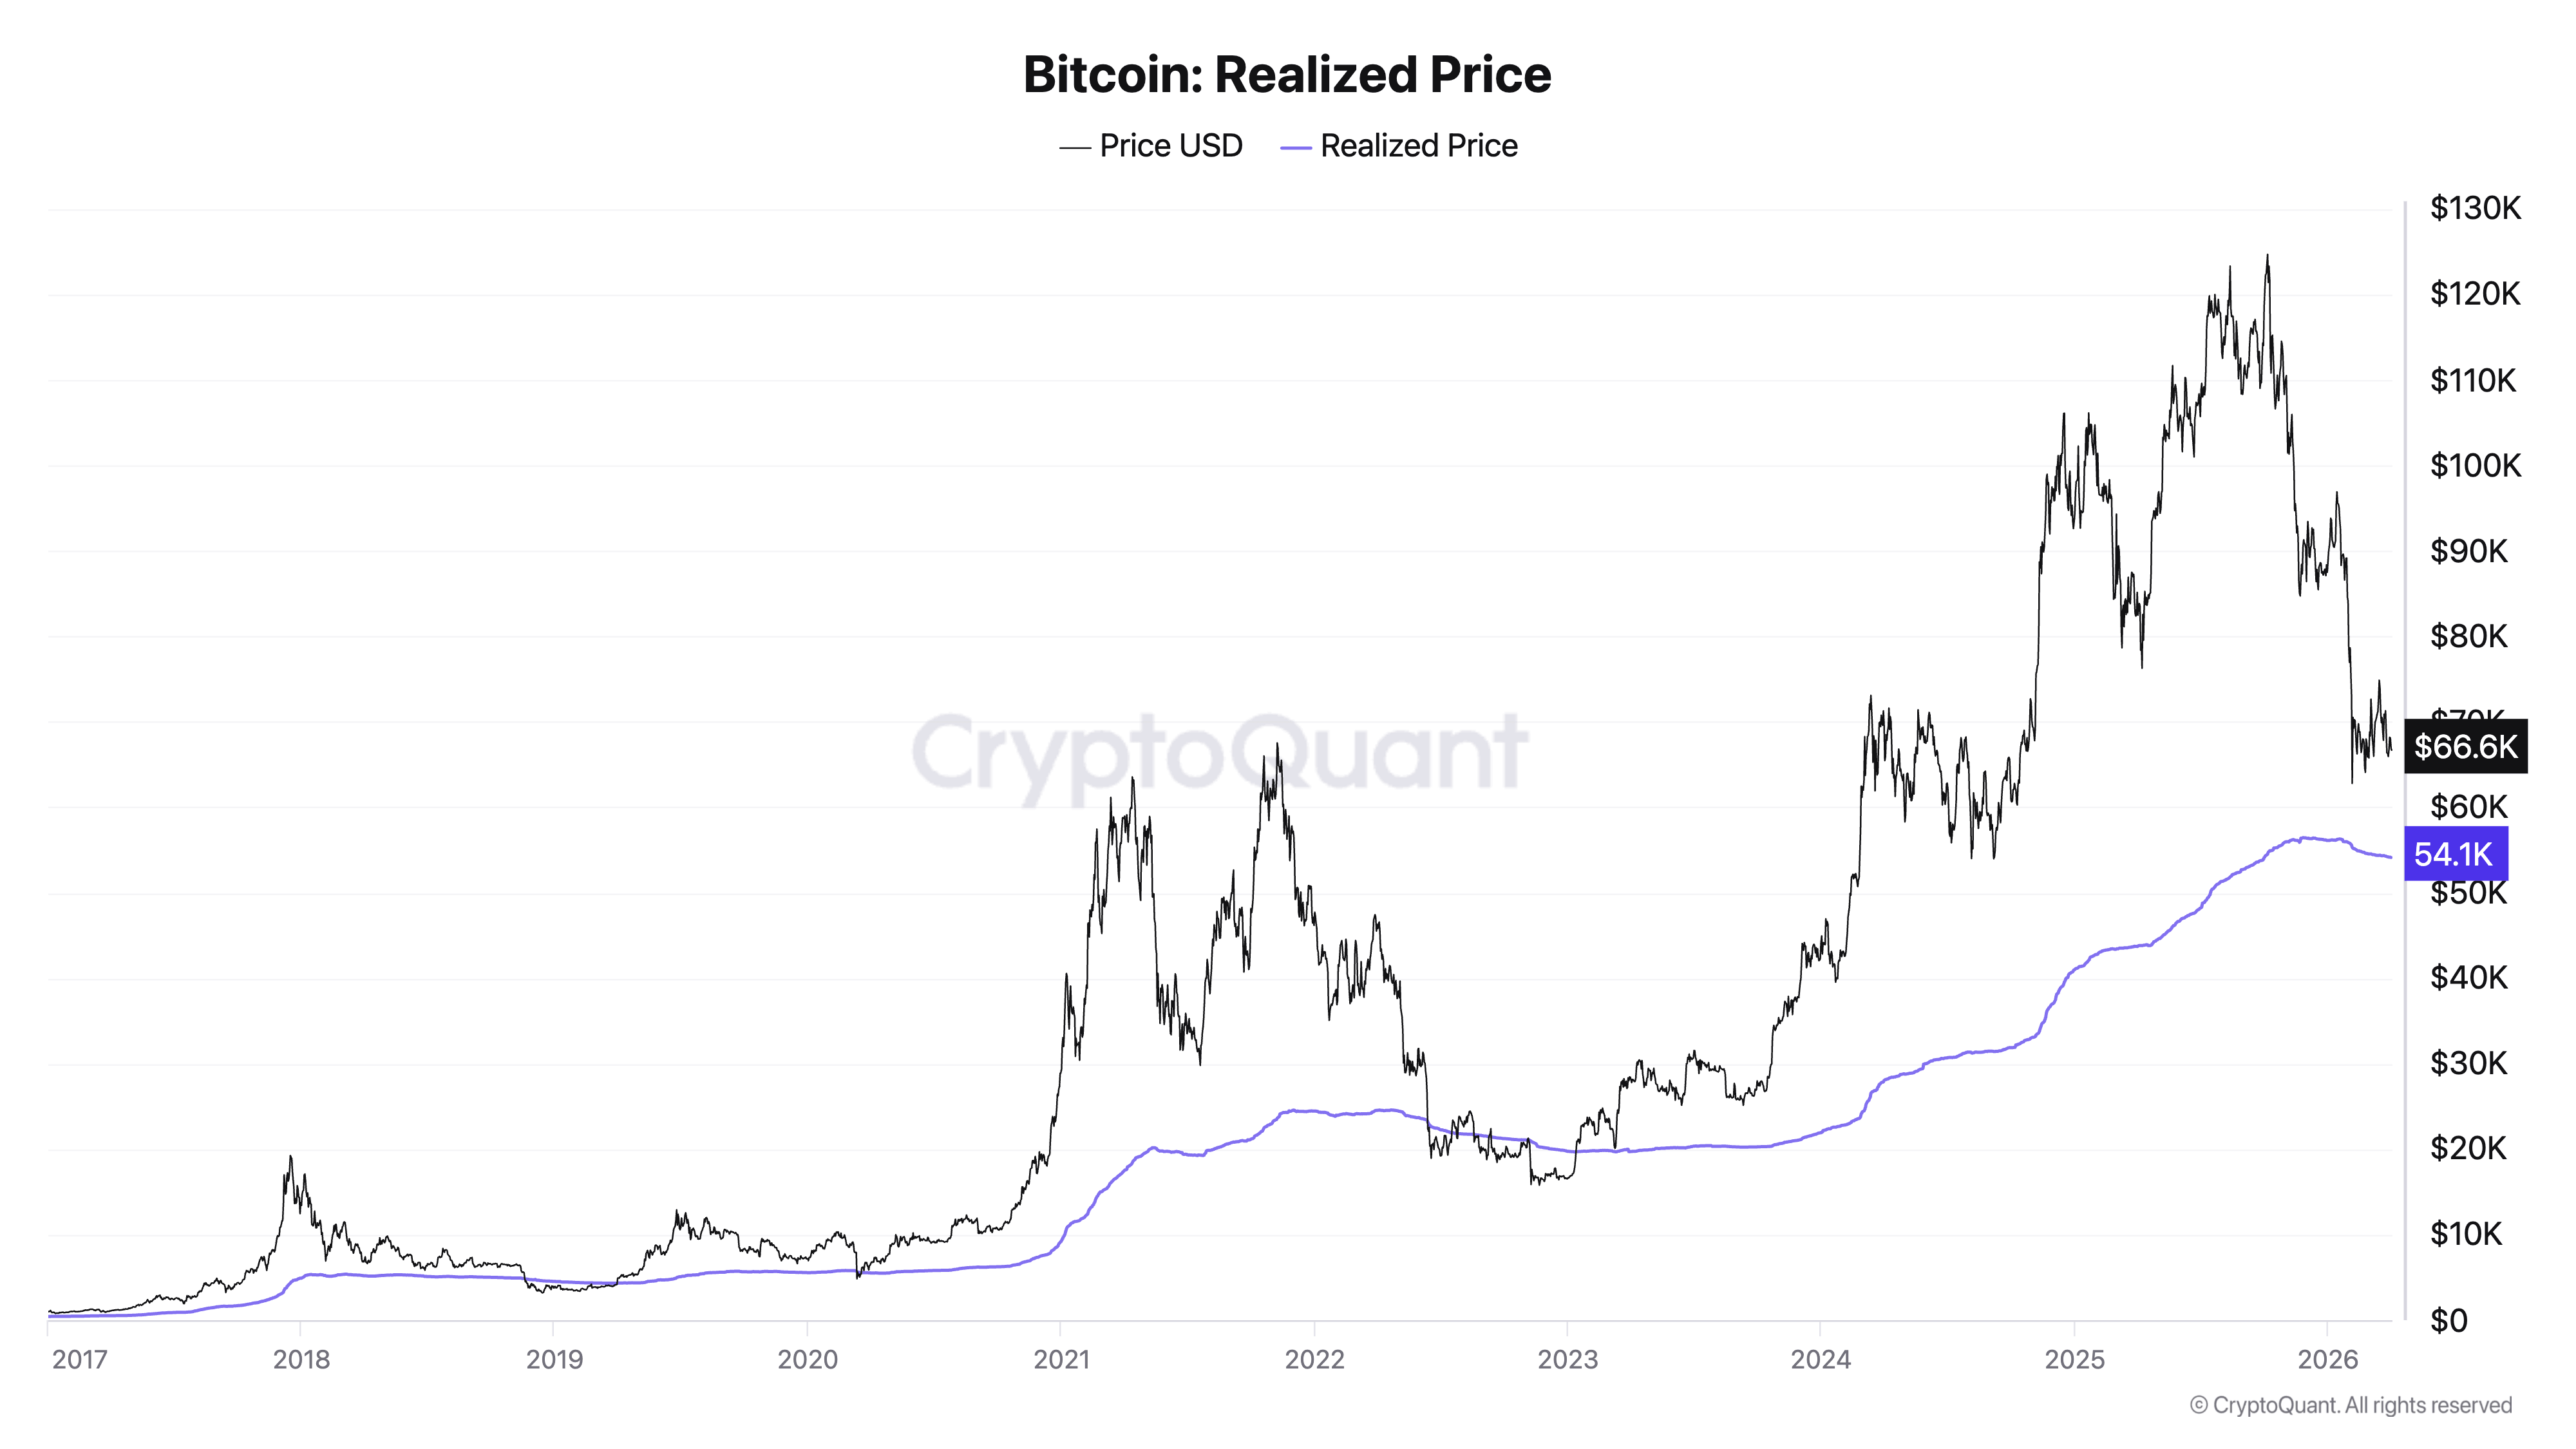
On-chain data provides valuable insights into the market's behavior, with the realized price being a key long-term anchor. It represents the average price at which the network's coins last changed hands, currently sitting near $54,100. Bitcoin remains above it even after this slide, meaning the average holder across the whole network is still not carrying any losses.
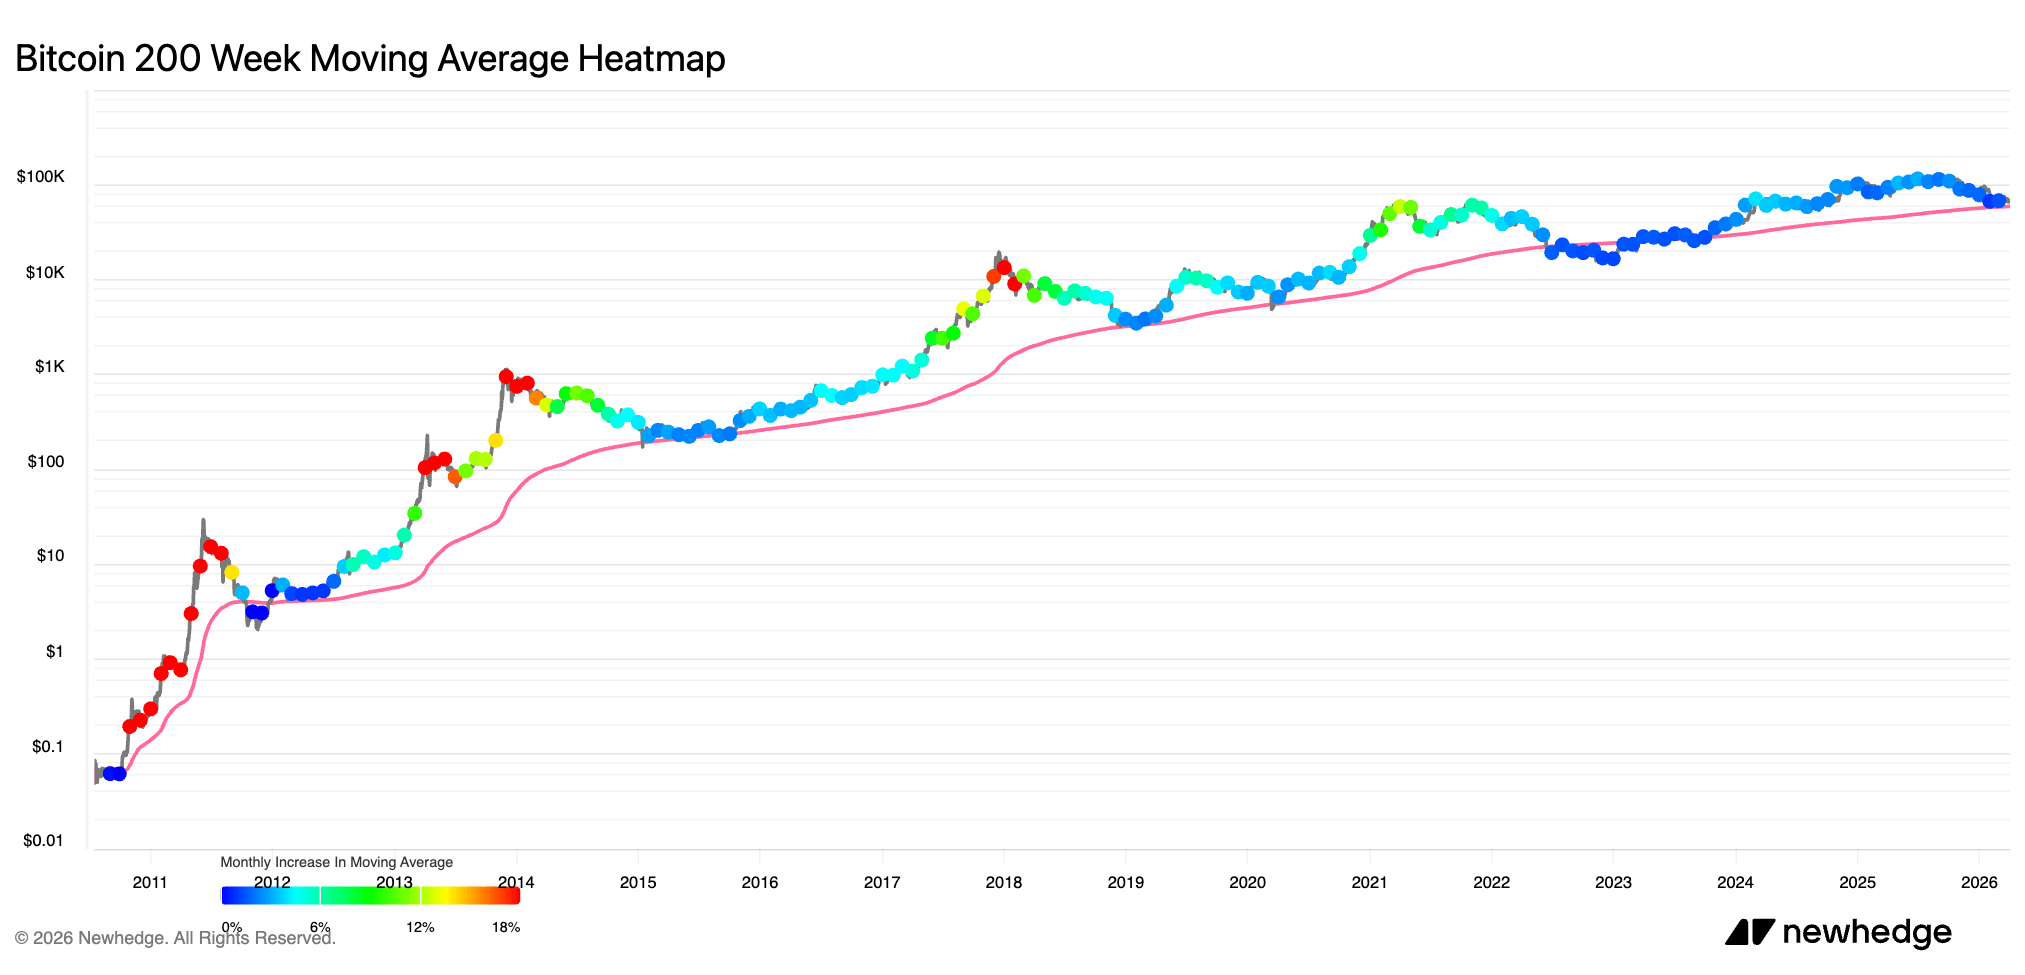
The weekly chart confirms this, with Bitcoin holding above its 200-week moving average, which sits around the high $50,000s. This leaves the market in a very unusual position, feeling weak enough to scare people and sour sentiment, while the foundational levels that past bear markets reached remain intact.
Key Factors to Consider
Looking at the current market, several key factors stand out:
- The $60,000 level is a crucial threshold, with a move back to this point potentially pulling even more of the market underwater.
- The average holder across the whole network is still not carrying any losses, with the realized price sitting near $54,100.
- The weekly chart confirms that Bitcoin is holding above its 200-week moving average, leaving the market in a very unusual position.
As the market continues to evolve, it's essential to consider these factors and their potential impact on the price. The data shows that Bitcoin's price is at a critical point, and the next few weeks will be crucial in determining the market's direction.
Our Take
Statistically speaking, the market is absorbing a serious amount of pressure, and the question of how much more it can take before the foundation shifts is one that the next few weeks will start to answer. As a data-driven analyst, I'm confident in the numbers, but humble about predictions, and I believe that the $60,000 threshold will be a crucial test of market strength.
The market's behavior will be shaped by a combination of factors, including on-chain metrics, price analysis, and external influences. As we navigate this complex landscape, it's essential to stay focused on the data and avoid getting caught up in hype or emotions.